Building Inflect
Prototyping Inflect
The most simple form of transformations pull events from a Kafka topic, transform them, and then push them to another topic. In prototyping Inflect, we took this basic approach using the Kafka-provided Consumer and Producer APIs.

One of the biggest benefits of using these APIs for our stream processing logic is that we can take full advantage of Kafka’s guarantees for exactly-once processing and message persistence. This means that if our app goes down, events sent by producers still make it to Kafka and are stored until the app starts back up, at which point any events that have accumulated in Kafka can then be consumed and processed by Inflect.

Transformations within Inflect are configured as Pipelines. A pipeline is defined by: The Source Topic from which events are consumed, The transformations and filters applied to those events and the order in which they are performed, And the Target Topic to which the transformed events are produced.

Our prototype defined a single Pipeline that received events, performed a basic transformation written in the source code, and then pushed the events to Kafka, one at a time.
Handling Transformations
For Inflect to achieve its goal of being easy for anyone from any team to hop in and use, we had to provide a way to author transformations easily and with a very minimal learning curve.
There are many options for specifying transformations in Kafka’s stream processing ecosystem. Some teams author their transformations using a declarative DSL, as in Apache Beam pipelines, Some use a specialized SQL-like language such as KSQL or Flink SQL, Some write transformations as functions that take in and return events, Still others connect a templating engine like Handlebars or Mustache, and author their transformations and filters using template files.
To achieve our goal of greater accessibility, we decided to support programmatic authoring of transformations as Javascript functions that receive an event object and return the transformed event.
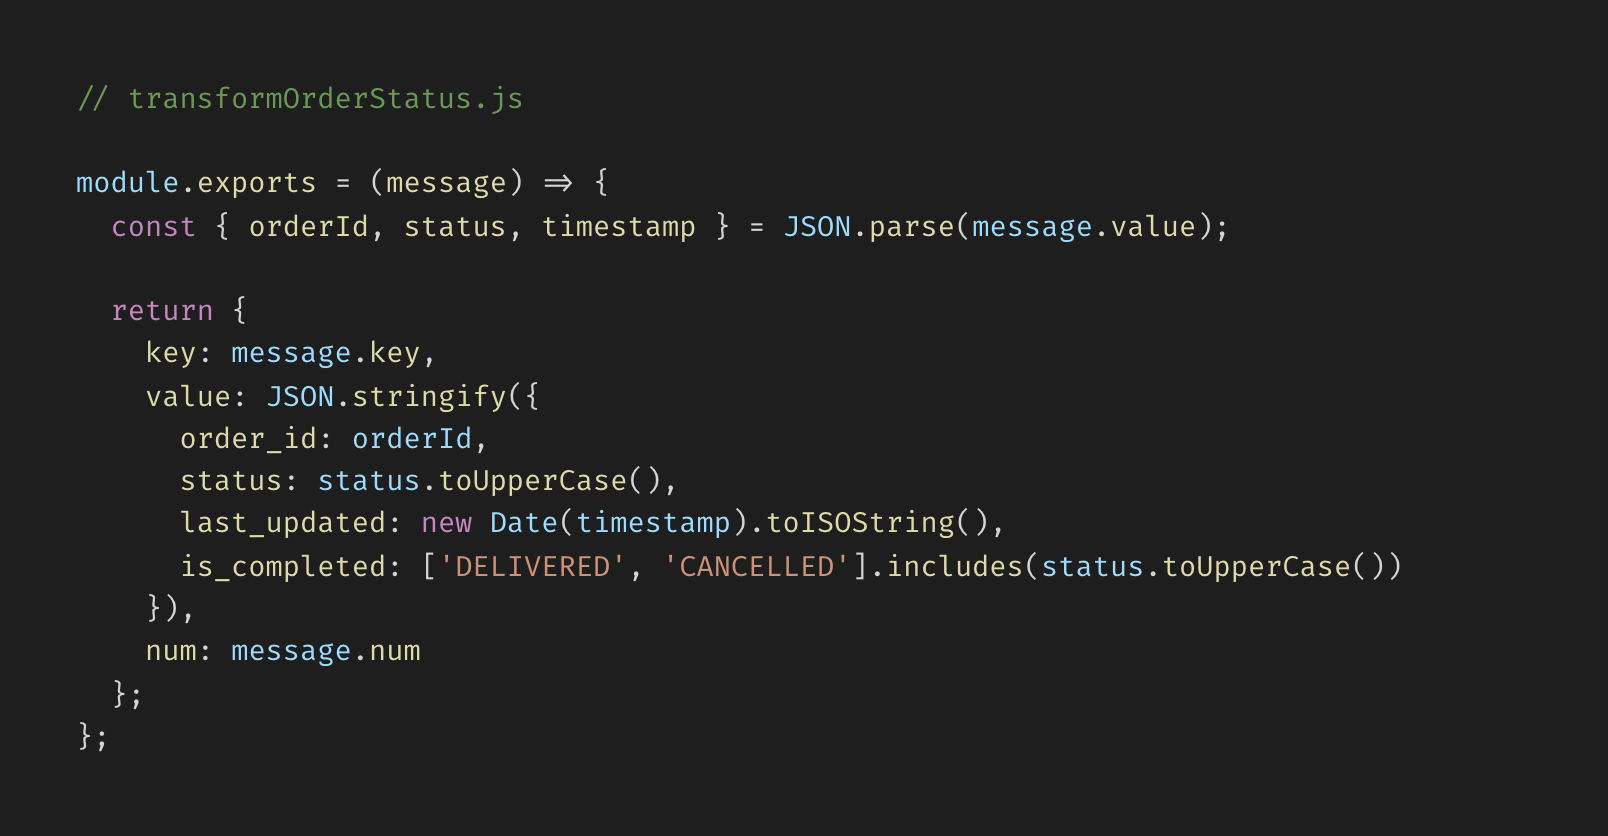
For very simple transformations, choosing this paradigm does come at the cost of slightly increased code complexity compared to the specialized stream processing languages listed above. However, the familiarity of Javascript and functional programming means that this approach is accessible to team members of varying levels of familiarity with stream processing. As for filters, we decided that the most intuitive extension of this function-based transformation authoring system would be to define filters as transformations that simply return a falsy value for rejected events. This is also the approach to filter authoring provided by stream processors like Apache Flink and Apache Beam.
One key benefit of having transformations authored in source code is that it is easy to fit these transformations into existing version control and deployment workflows. This means that changes to transformations can remain subject to the review and deployment processes that teams have in place in their codebase.
Managing Pipelines
Authoring Pipelines
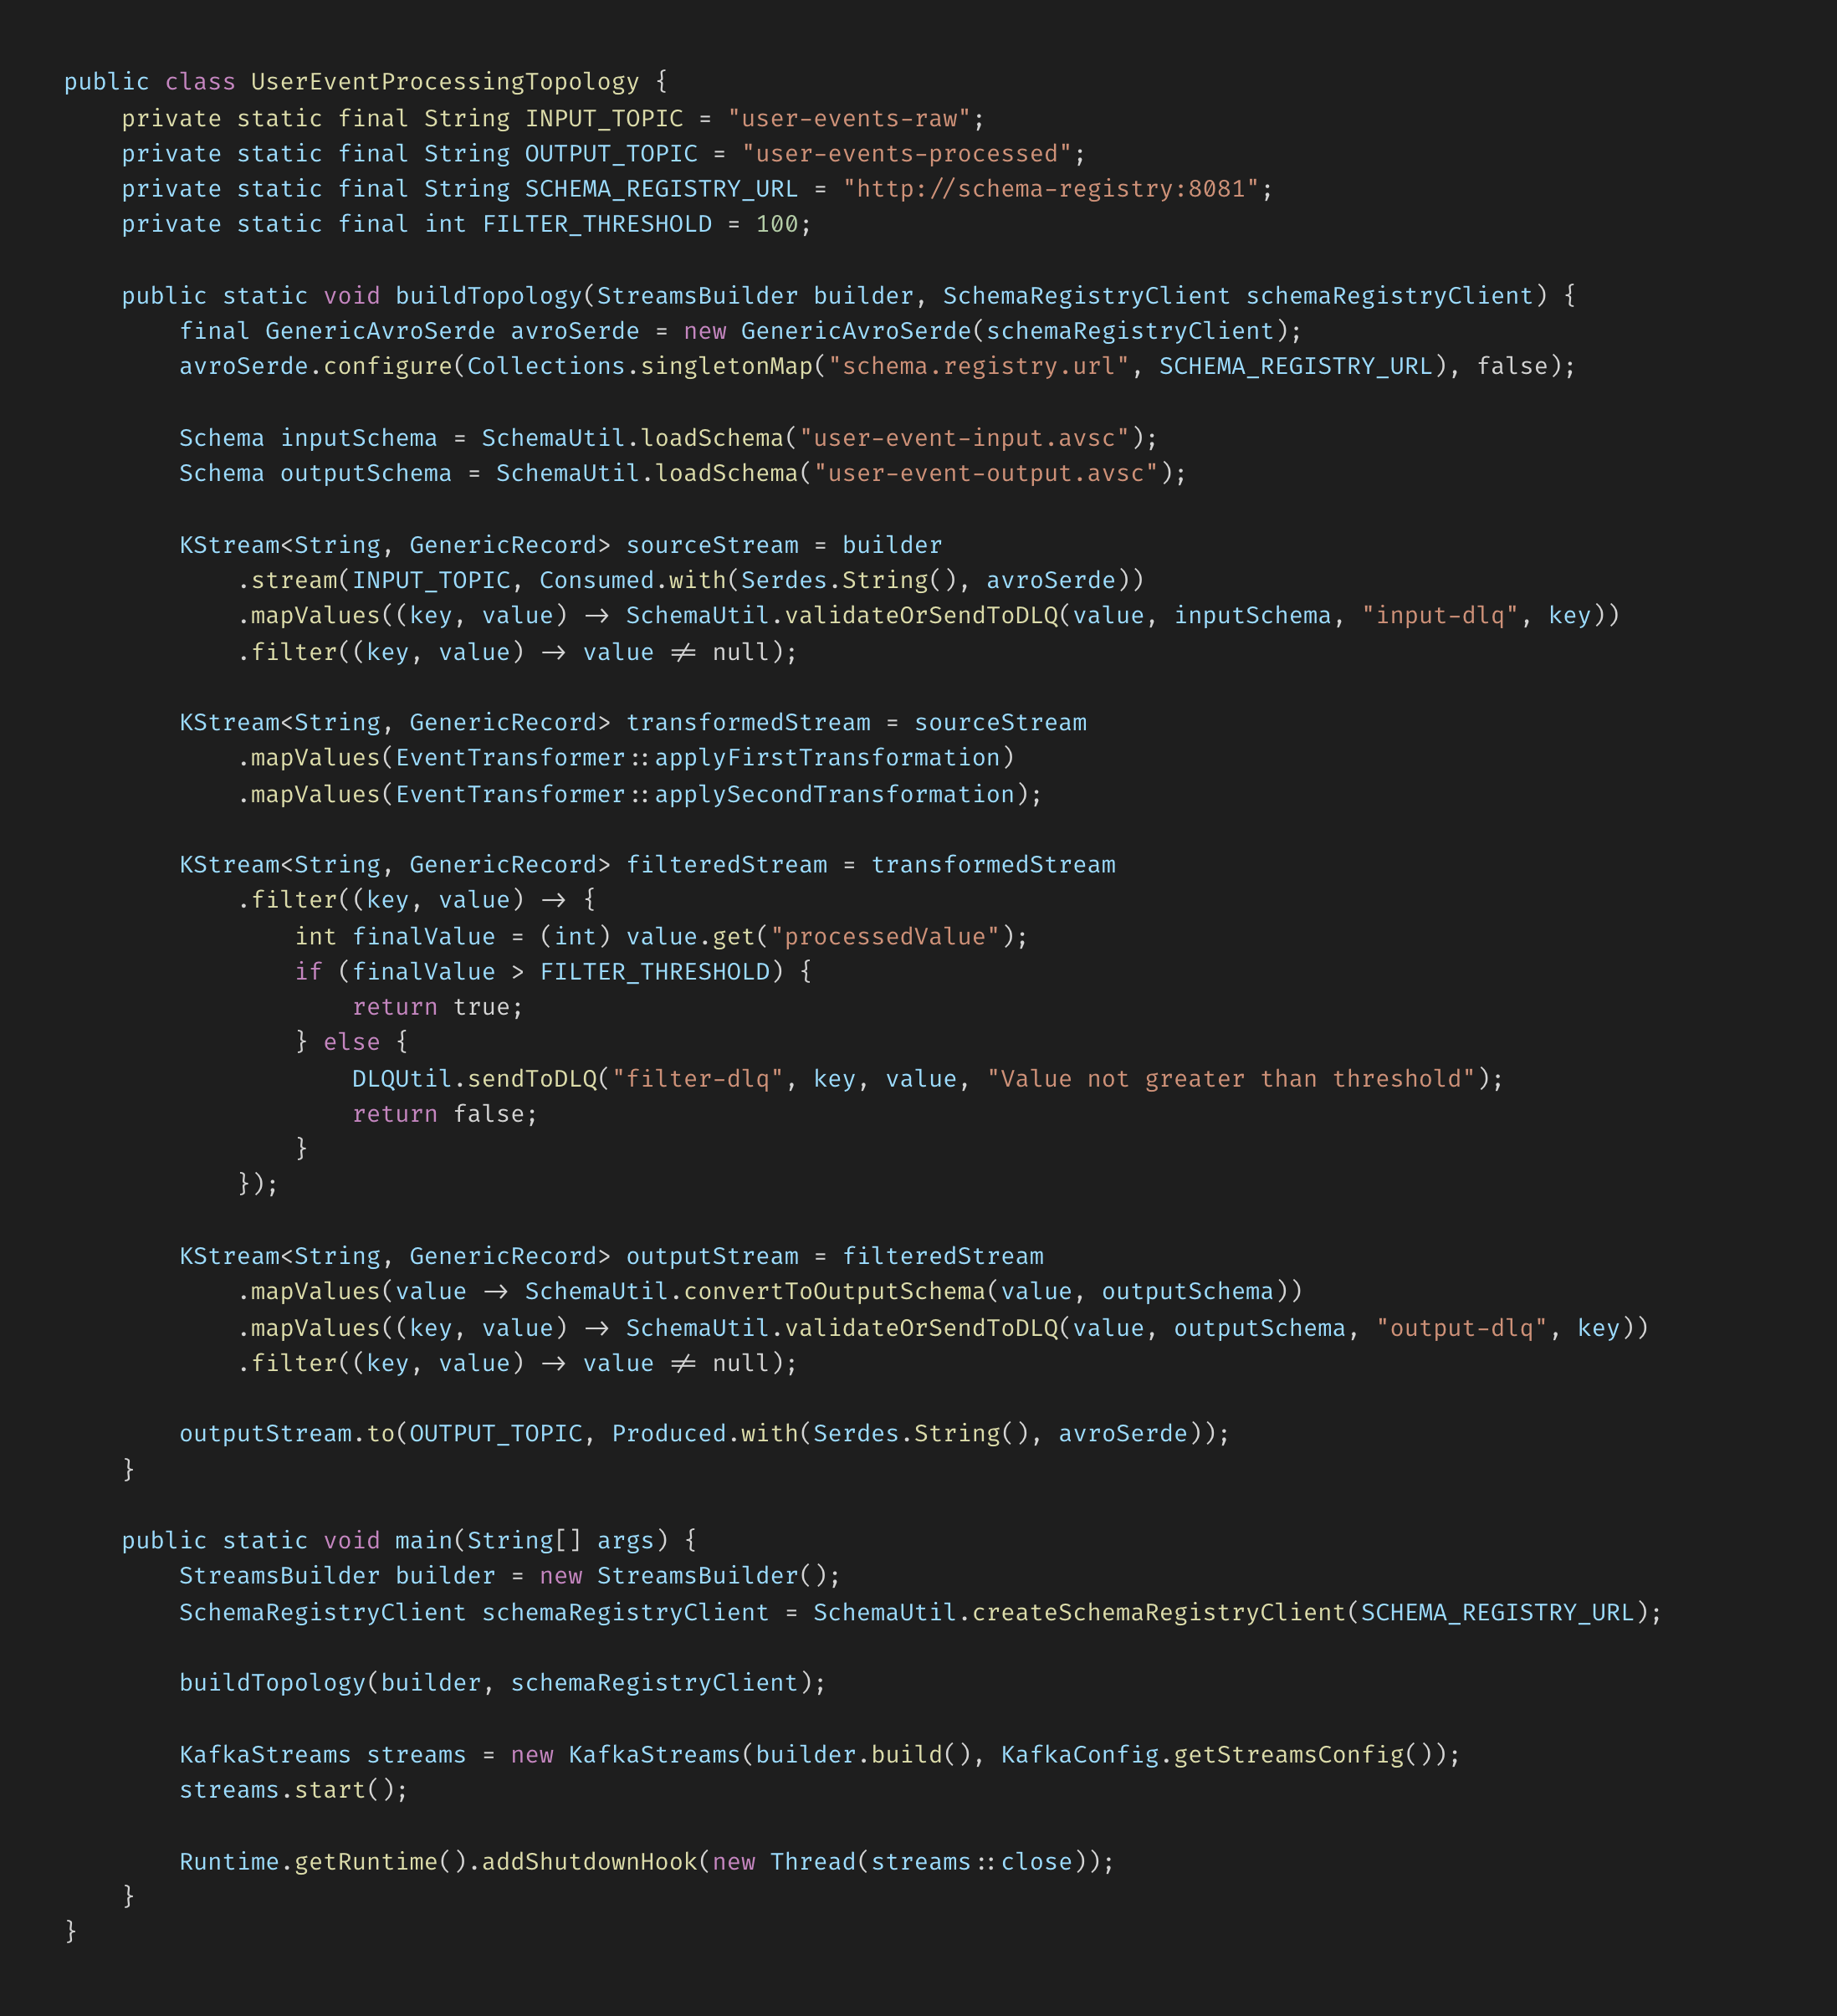
Once a team has authored the transformations that they want to carry out, they have to then specify all kinds of pipeline-related logic, including what topic to pull the events they want to perform those transformations on, in what order they want those transformations and filters to be performed, what to do with events that fail a step or get filtered, and what schema events should conform to. When written using stream processor-provided APIs, the code for these transformation pipelines can become dizzying.
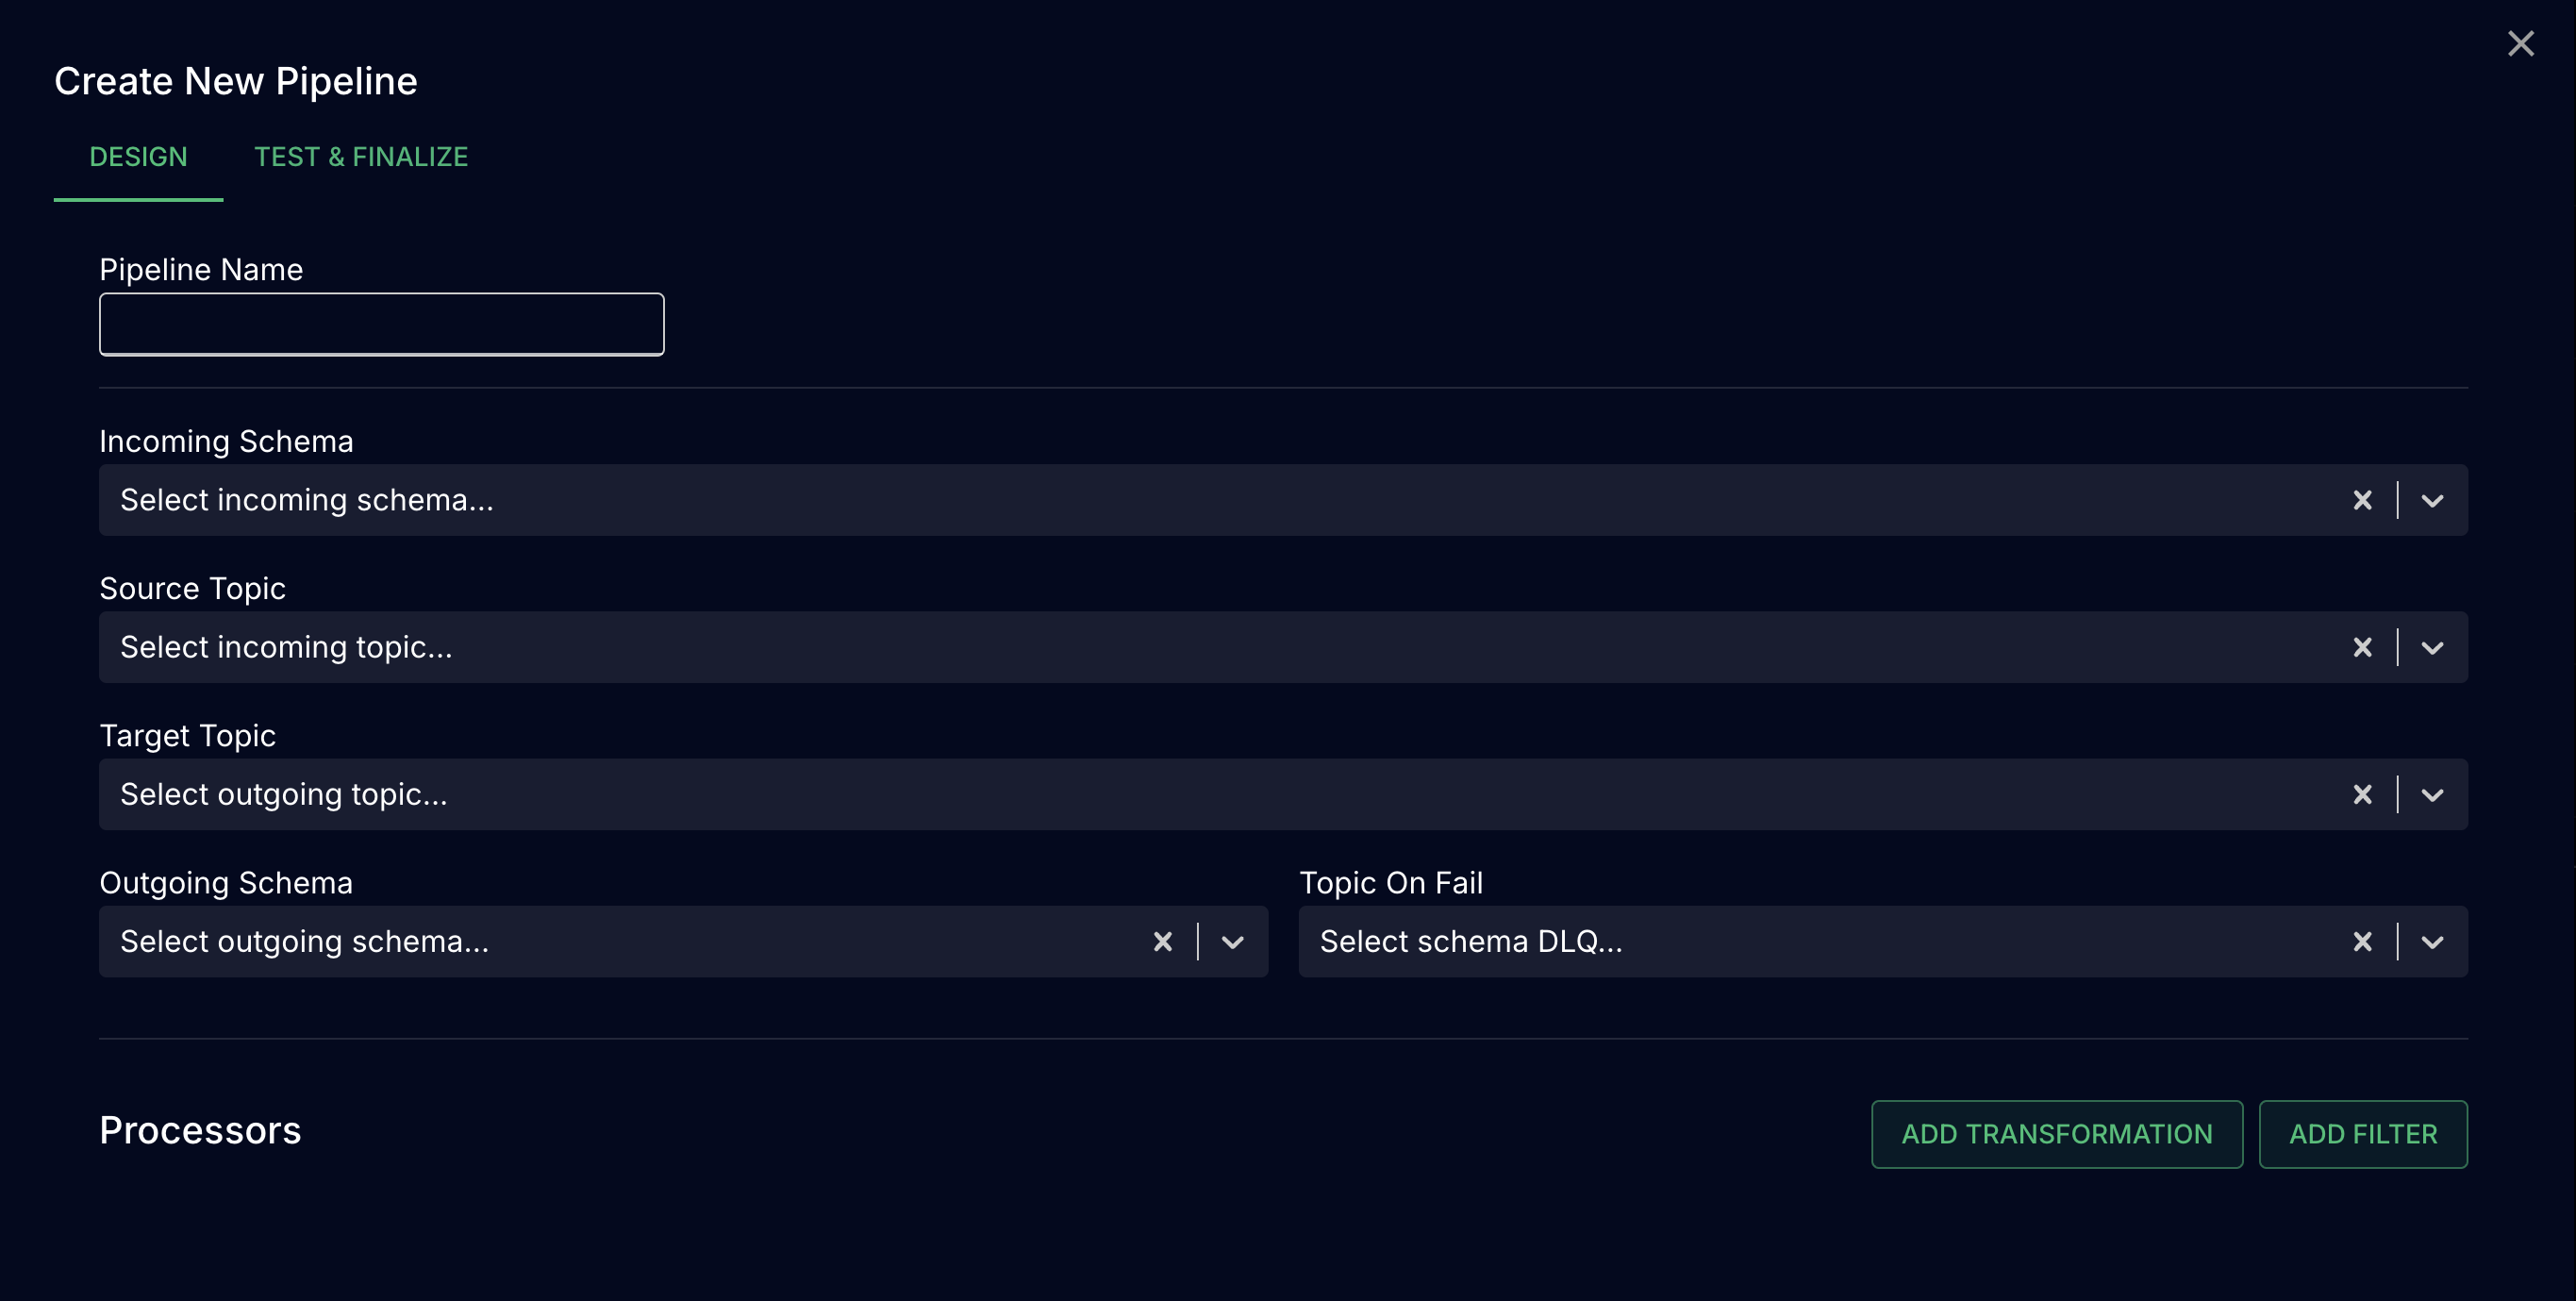
To make that process more intuitive, we created a visual user interface for authoring the sequence of steps in a pipeline, circumventing the need for a framework-specific DSL. Because transformations are authored as Javascript functions within a directory in the user’s codebase, they can be reused by different pipelines and chained together to achieve complex transformations using a flexible and modular approach.
The UI is a browser-based React application that features a dashboard for viewing the status and basic attributes for each pipeline in Inflect, and an interface for creating and modifying pipelines using dropdown menus pre-populated with topic names from Kafka, schema names from the organization’s schema registry (see below), and transformation names from their transformation directory. The UI provides a centralized view of all pipelines in Inflect, helping to organize and manage the various transformations in play in an EDA, which becomes more important as EDAs grow and the number of transformation pipelines increases.
Schema Registries
The schema registry is a key component in event-driven architectures, particularly when working with Kafka. It's a centralized repository for managing and validating event schemas, which are structured definitions of the format and content of events. By using a schema registry, organizations can ensure data consistency and improve overall data quality across their event flows. For Inflect, integrating with the schema registry allows users to easily select and apply appropriate schemas to their pipelines, ensuring that events conform to the expected structure before and after transformations. Users of Inflect bring their own schema registry (which they will already have if they use schema in any part of their EDA), which they can connect with Inflect during setup.
Testing Pipelines
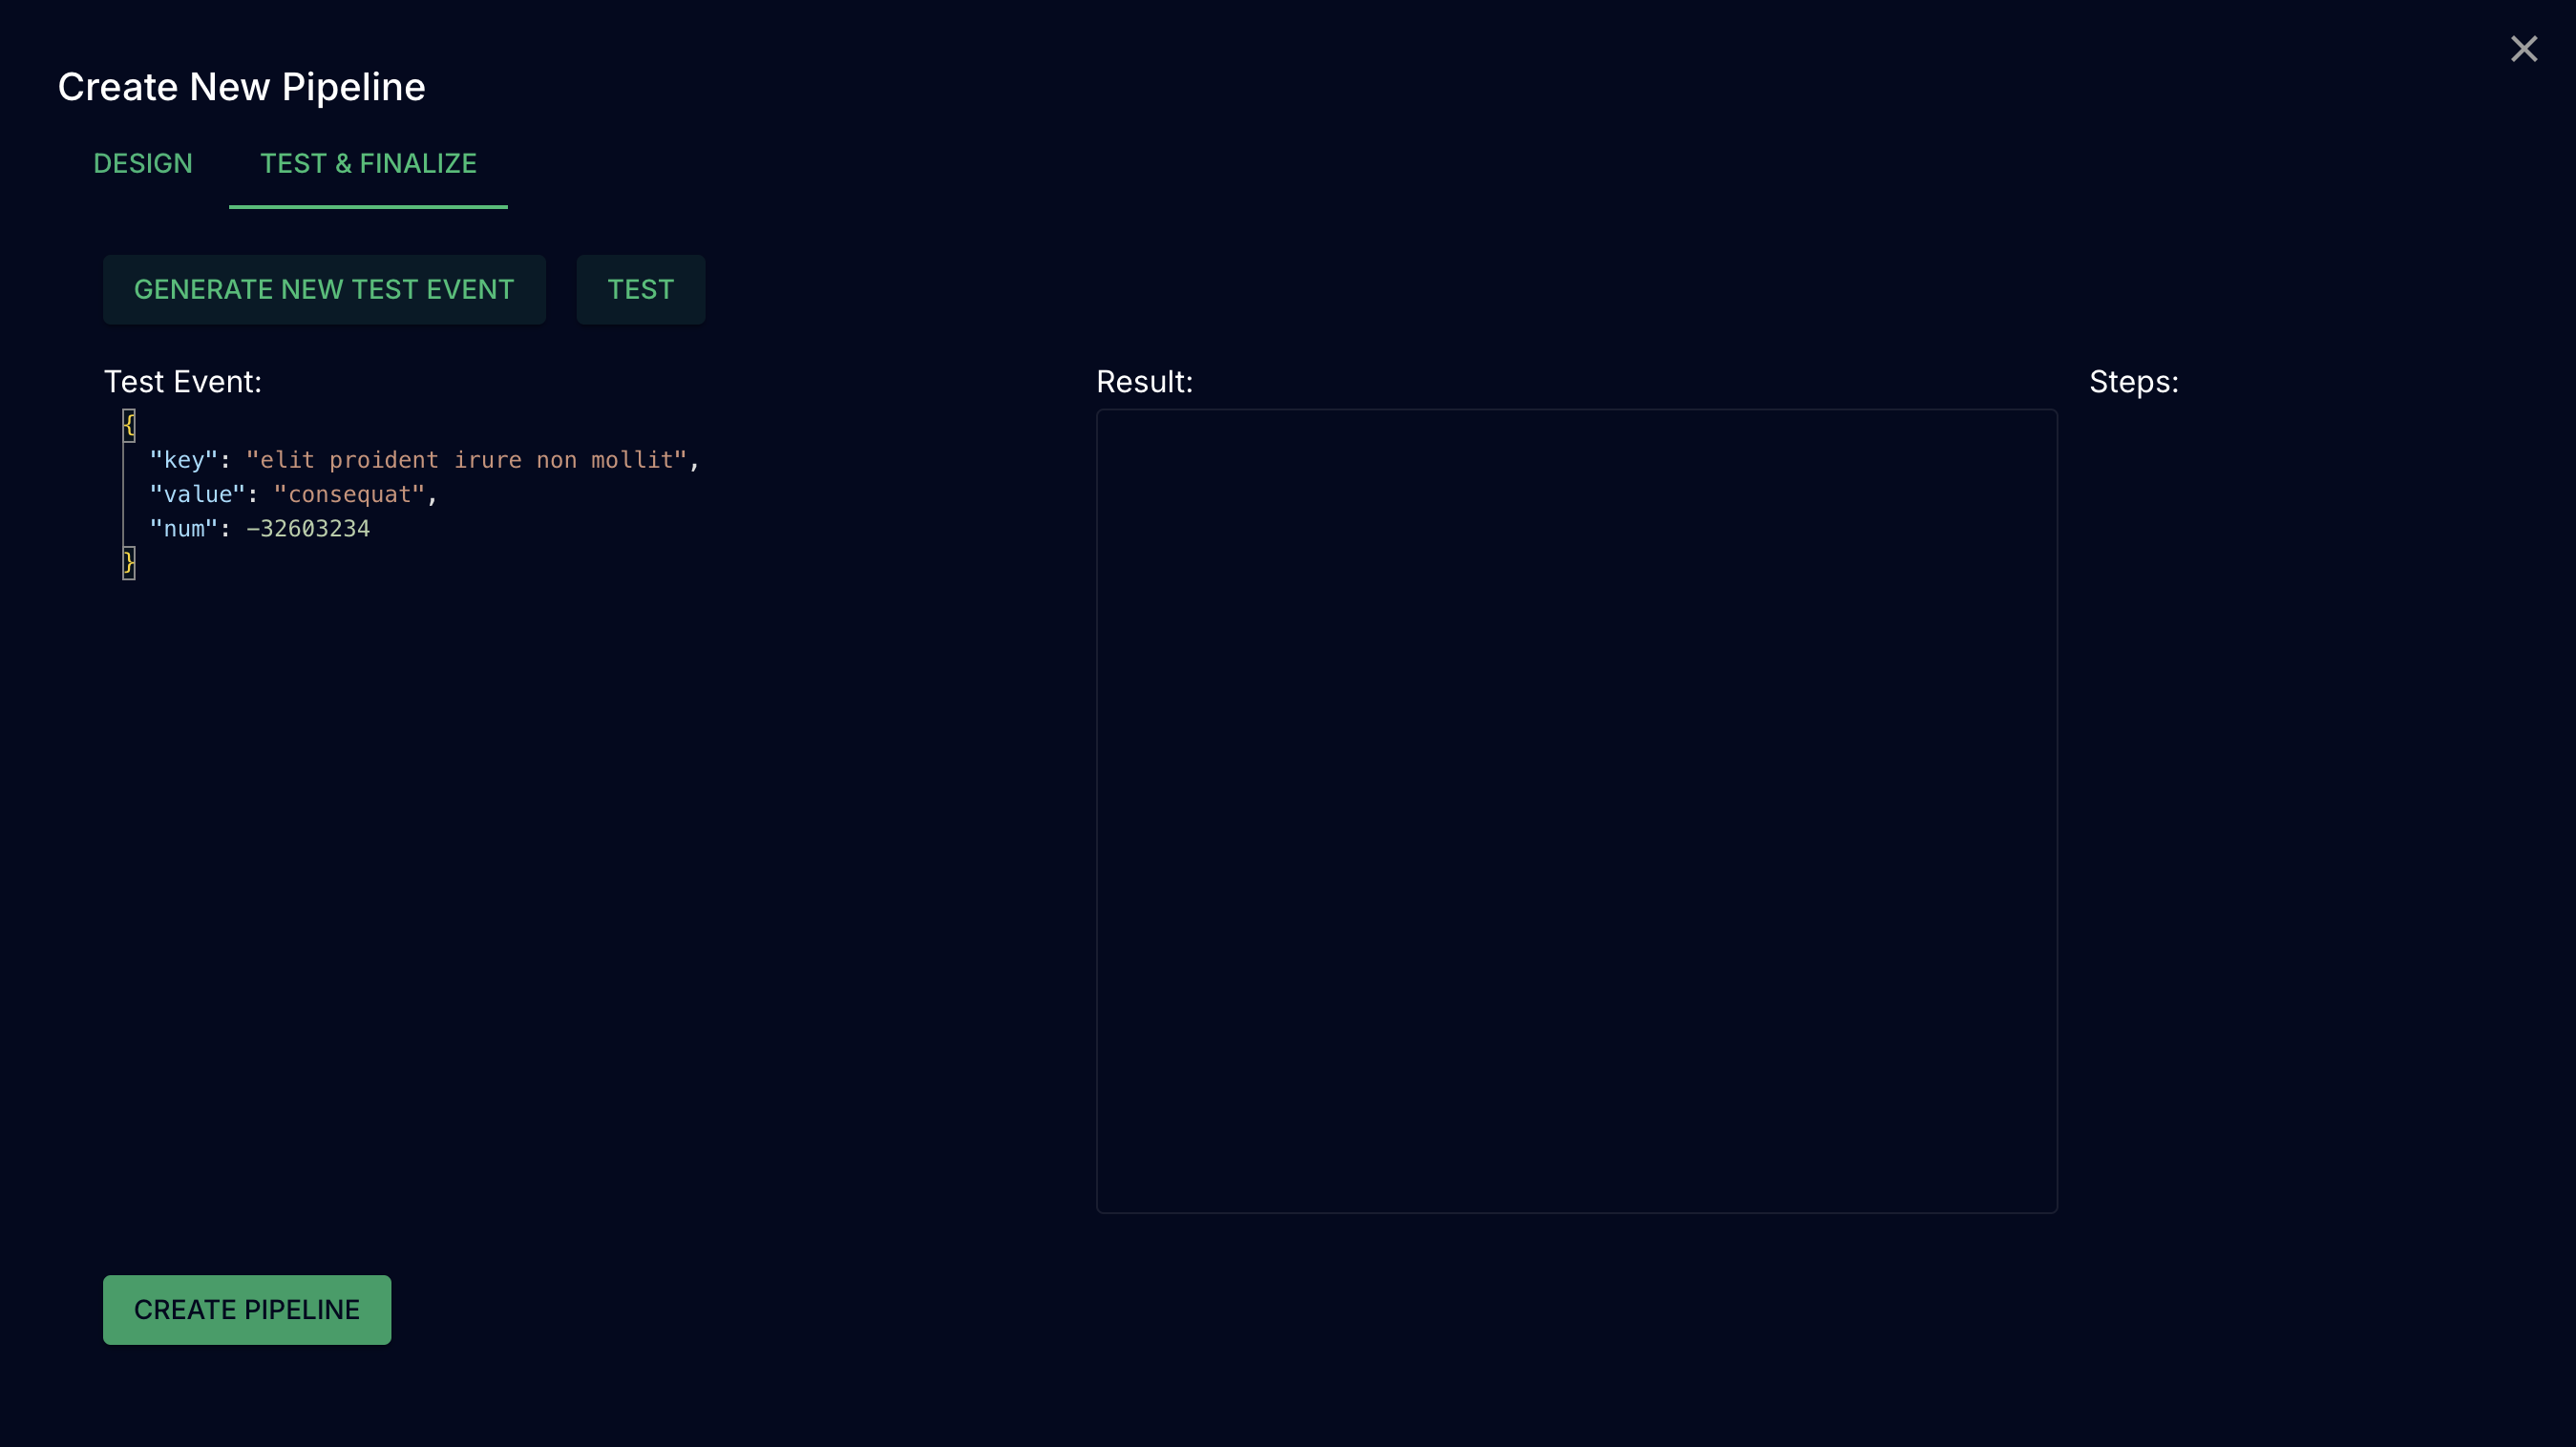
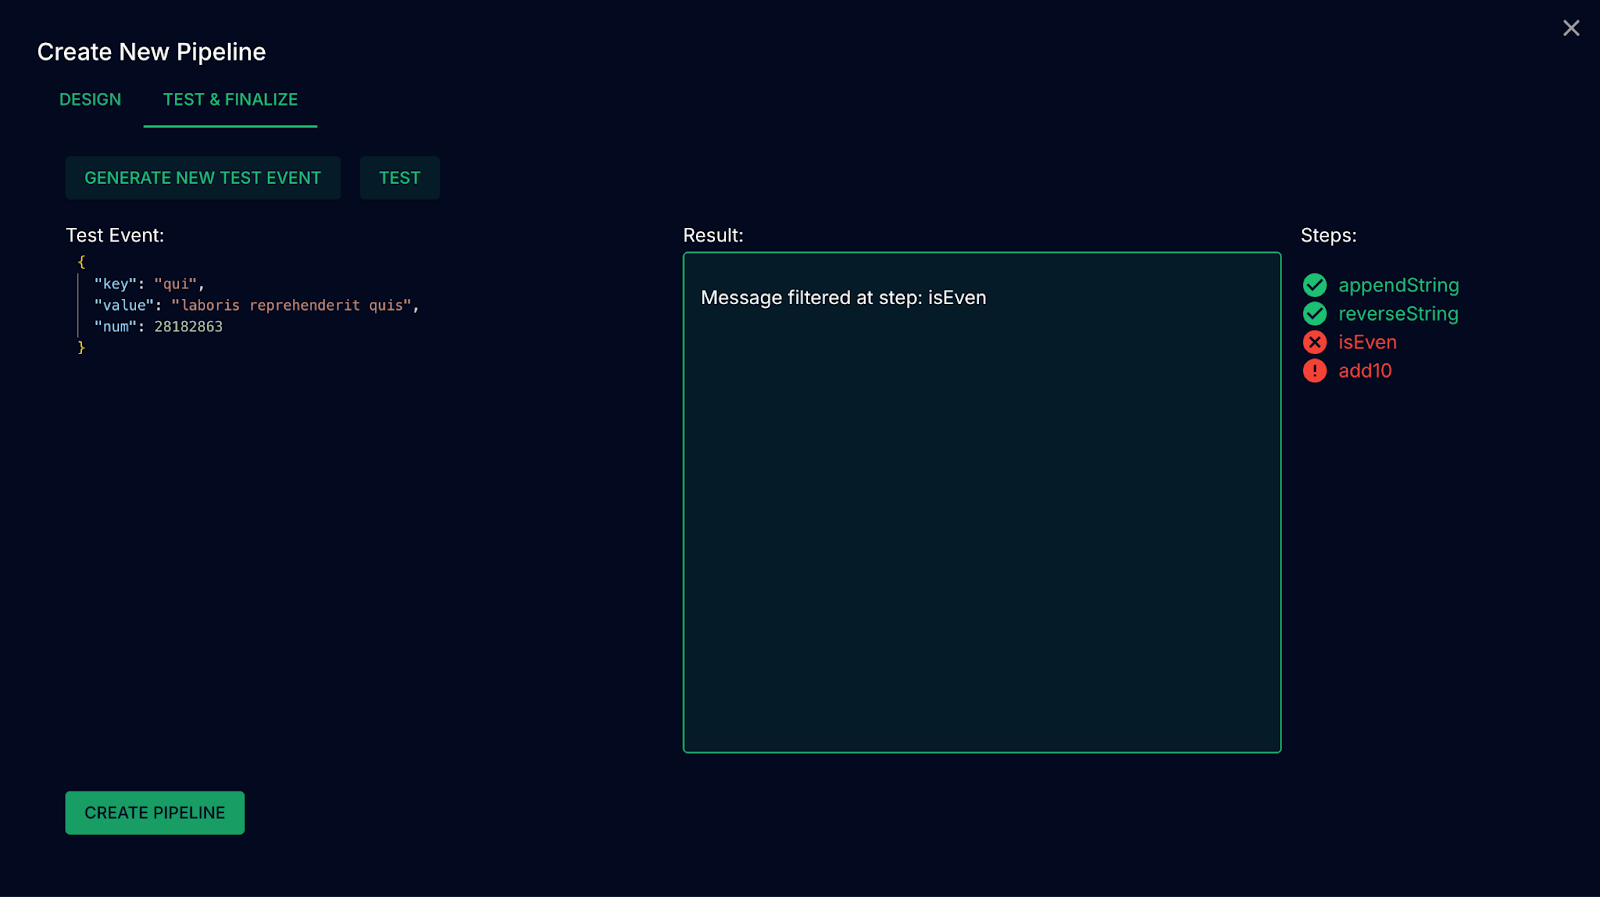
In a production system, developers want to be able to test out pipelines before deploying them so as to ensure that any changes they make are non-breaking and produce their intended output. However, doing so often requires spinning up a test environment that produces test data, or disrupting existing data flows in production. To make this critical aspect of managing transformations easier, we provide a user interface for performing tests on complex, multi-step pipelines prior to deployment.
The UI makes it possible to: automatically generate test events based on the schema of incoming messages, modify those events as needed within the UI, and then pass those events as requests to an HTTP server, The server then pulls the schema, transformations, and filters used by that pipeline, and executes every step of the pipeline, from incoming schema validation, to each transformation and filter, to finally outgoing schema validation. After passing the test event through the pipeline, the server reports back to the client with the output of the pipeline, as well as information on what step the event failed or was filtered at.

Persisting Pipelines
Given that in Inflect, the sequence of steps in a pipeline is authored visually in a UI, and not authored programmatically like a pipeline’s constituent transformations, these pipelines are not persisted in source code. So, we needed a way to store pipeline information and access it when starting up or changing a pipeline. Our solution was to use a PostgreSQL database to store information about the various elements of a pipeline – the names of schema for incoming and outgoing validation, the names of transformations and filters, and the names for source, target, and dead-letter queue Kafka topics – in a structured way. PostgreSQL's combination of reliability and flexibility made it well-suited for storing our complex pipeline structures while supporting rapid access and updates.
We also use PostgreSQL's LISTEN/NOTIFY feature to ensure that the currently running pipelines are always up to date with the database. This mechanism allows for real-time synchronization between the database and our application’s HTTP server, whose job is to receive HTTP requests from the client and interact with the database, pull information from the Kafka broker, or test out pipelines and send the results back to the client. When changes are made to pipeline configurations in the database, it sends notifications through the LISTEN/NOTIFY system. Our application servers, maintaining open connections to the database, listen for these notifications and immediately fetch the updated configurations upon receipt, and then respond accordingly. This approach enables dynamic creation and reconfiguration of pipelines without requiring system restarts.
Application Architecture
At this point in our development, Inflect is composed of: A Client UI, a Postgres database, a server that communicates with the Kafka broker, the user’s Schema Registry, and the Postgres database; and the stream processor itself, a Javascript application which performs stream processing on events from Kafka, independent of the server and client

Scaling our App
Managing Event Data
EDAs typically manage a constant flow of events as users interact with the system or state changes occur in different components. As a result, event brokers like Kafka can be tuned to handle 100,000+ messages per second on a single broker, and millions per second in a cluster. So, in order to not become a bottleneck for the system’s performance, stream processors must be able to support very high throughput.
Streams as a data type
When dealing with a constant, high-velocity flow of data, developers often use Streams as a data type. Streams are an abstraction meant to represent unbounded sequences of data arriving continuously over time, allowing developers to write code as if they were performing real-time processing of the stream as a whole. This is why they are frequently used as the underlying data structures in many existing stream processors, including Kafka Streams, Apache Samza, and Flink.
However, our use case pertains to independent, “stateless” operations, where each event is processed without regard to the state of other events. Because of this, the use of Streams as a data type would incur significantly greater complexity and overhead than necessary, since maintaining a Streams data type requires continuous processing, significant memory allocation for buffering of events, and handling of asynchronous data flow.
Luckily, the Streams data type is not our only option for supporting high throughput.
Batch Processing of Streams
Our implementation of stream processing utilizes a batch processing strategy for handling the incoming stream of events. Batch processing refers to the approach of collecting and processing many events together as a group, rather than processing each event individually as it arrives. In our implementation, each event in a batch is transformed in parallel, but independently of all others – no state is maintained between events in a batch.
Using batch processing confers several key benefits over streams for our use case: Efficiency: By processing events in batches, we can reduce the overhead associated with fetching and processing each event individually, leading to improved throughput and resource utilization. And since our use case involves stateless operations, batch processing eliminates the need for complex state management associated with streams as an abstract data type. Simplicity: Batch processing allows for a simpler programming model compared to continuous stream processing, making it easier to implement and maintain the system. Scalability: Batch processing can be easily parallelized, allowing us to scale our processing capabilities horizontally as the volume of incoming events increases.
The tradeoffs of adopting batch processing are that doing so introduces latency for individual event processing, since events have to be placed in a batch before they can be processed. However, for high velocity data flows like those at play in an event-driven architecture, batching reduces overall latency significantly compared to event-at-a-time processing because of how great the overhead for sending and receiving events is. Additionally, batch processing can make it more challenging to handle time-sensitive operations or maintain strict event ordering when required, but because Kafka handles message ordering within partitions, it can still provide strong ordering guarantees when batch processing is used.
Stream processing is often contrasted with batch processing, but under the hood, many stream processors, including Apache Spark Streaming and Apache Flink (Flink can be configured to use either Streams or batching), actually carry out micro-batch processing on a constant flow of data. Because these stream processors are batching constantly on incoming event data, they can go toe-to-toe on performance with stream processors that use a Streams-as-a-data-type model.
Parallelization
Switching from event-at-a-time processing to batch processing brought the throughput of our system up from a few hundred 4-step transformations per second to a few thousand. For many use cases, this performance is perfectly sufficient, but for large, complex EDAs, we needed to be able to support much higher throughput. We turned to parallelization to help.
Parallelization is the process of dividing a computational task into parts that can be executed simultaneously. This enables greater computational performance because multiple workers are handling tasks simultaneously. For Inflect, this means running multiple instances of the stream processor, each processing a fraction of the events coming in from Kafka, rather than having one instance of the app handle all events. Given sufficient hardware, if one instance of the app is capable of handling 30,000 events per second, then 3 instances of the app running in parallel would be able to handle a total of 90,000 events per second.
This is possible because of Kafka’s support for consumer groups, which are sets of consumers that each process a portion of the traffic consumed from a Kafka topic.


Kafka dynamically divides the event traffic between the consumers, and continually rebalances the consumer group when consumers are added or dropped. So, what we needed was some mechanism of running multiple event processors at once so as to handle multiple event streams from a Kafka topic at once.
The Manual Approach
One way to achieve this would be to manually run multiple instances of the stream processor. The stream processor is simply a Javascript application, so this could be done by starting the same processing function multiple times, each instance handling a portion of the incoming data. While this approach might initially seem straightforward, it comes with several drawbacks.
Function calls alone don’t provide a robust solution for managing the lifecycle of long-running processes, like a stream processor. If a function crashes or the host machine fails, there’s no built-in mechanism to automatically restart it. This can lead to reduced processing capacity and performance bottlenecks until manual intervention occurs.
And, as the number of instances grows, managing them becomes increasingly complex. There’s no built-in mechanism to monitor the health of all instances, update them, or adjust their number based on current traffic. Each change or deployment would require manual coordination across potentially many instances. Resource allocation also becomes an issue as the system grows. Using this manual approach, it’s challenging to efficiently distribute these function instances across available hardware, potentially leading to underutilized resources on some machines and overload on others
Serverless Functions
Serverless platforms like AWS Lambda, Google Cloud Functions, and Azure Functions are useful for automating parallelization and scaling of functions. These platforms handle the complexities of instance management, automatically spawning new instances as needed to handle increased load, and scale down during periods of low activity. For example, developers often AWS lambda functions to process records from Amazon Kinesis data streams, with AWS automatically executing the lambda functions as needed in response to incoming data.
These serverless functions are also stateless, making them well suited for the stateless transformations Inflect is designed to perform. But, choosing a managed solution like this wouldn’t fit very well with our goal of building a self-managed solution independent of any particular cloud vendor.
Docker Swarm
Docker Swarm is another option for running multiple copies of our stream processor. It’s a tool that comes with the containerization tool Docker, that allows us to spin up multiple Docker containers – basically lightweight, isolated environments for running applications – and manage them as a single system. However, Docker Swarm doesn't have a large open source community, and lacks some of the third-party tools we might need for our use case.
The final option we considered for enabling parallelization is Kubernetes. In the next section, we discuss Kubernetes, why we chose it for Inflect, and how we used it to implement parallelization.
Kubernetes
Because Inflect tackles the use case where teams want control over their event processing infrastructure, we chose to use Kubernetes (k8s) for parallelization. Kubernetes is an open-source container orchestration platform, meaning that it automates the deployment, scaling, and management of applications deployed as containers. It’s self-hosted, allowing organizations to deploy and manage their own infrastructure, providing full control over their data and processing environment. It offers excellent scalability, making it ideal for deploying many instances of our app to support high throughput. And it has a robust open-source community, which means that we have access to a wealth of resources, tools, and shared knowledge that significantly simplify development and troubleshooting.
To deploy Inflect on Kubernetes, we containerized the core stream processor with Docker to make it available as a template for easily deploying many instances of the app. When deployed, the current transformation pipelines are pulled from the PostgreSQL database, which is also deployed as a Kubernetes instance, and for each pipeline, a deployment is created, each with several pods, or replicas of the app running at the same time in its own environment. Kubernetes manages spinning up each of these instances automatically, making it simple to deploy many different pipelines at once in Inflect, and to have each pipeline’s processing work divided across multiple instances of the app.

Kubernetes provides self-healing mechanisms, automatically re-deploying pods that fail, as well as automatic horizontal scaling based on resource utilization or custom metrics. And for Inflect, because instances can be spun up or killed at will, Kubernetes is well suited for our use case where users want to create or edit pipelines mid-production without affecting other pipelines as they’re running.
Scaling with Load
Being able to deploy many instances of each pipeline with Kubernetes means that we can now handle significantly higher load than before. On commodity hardware, a single pipeline deployed as 3 instances was able to process tens of thousands of events per second. But, in a production system, load can change significantly over time, meaning that during some periods of low activity, many instances of the app will be underutilized or dormant. Given that we want to be able to both support high load during peak times and also not waste system resources during periods of low event traffic, we want the number of instances of the app to scale up and down in response to load.
Kubernetes Event-Driven Autoscaling
To achieve dynamic scaling based on load, we implemented Kubernetes Event-Driven Autoscaling (KEDA). KEDA is an open-source, Kubernetes-based autoscaler that enables fine-grained autoscaling of containers deployed on Kubernetes. KEDA can be used to scale instances up and down in response to many different metrics from many different sources.
For our app, the metric that made the most sense as the trigger for auto-scaling was consumer lag, which represents a delay between when messages arrive in Kafka topics and when a consumer application consumes them. More lag means more events are sitting in the topic waiting to be consumed at any given time.


By configuring KEDA to respond to changes in consumer lag, we enabled our system to automatically adapt to varying loads, increasing the number of app instances when load goes up and decreasing the number of instances when load goes down.


With our system now scaling the number of app instances up and down with load, instances were frequently being spun up and killed. This auto-scaling behavior introduced two new issues.
Graceful Shutdown
The first issue is that if an instance of an app is killed due to a decrease in load while in the middle of receiving or processing a batch of events, these events can be lost and fail to make it to their destination. To ensure that all currently received events are safely processed before an instance of the app is terminated, we implemented a graceful shutdown solution wherein the instance receives the shutdown command and then stops accepting new events, finishes processing any in-flight events, and only then proceeds to shut down.
Partition scaling
The second issue with auto-scaling has to do with how Kafka partitions work. Kafka topics are composed of partitions, which are subdivisions of a topic that allow Kafka to distribute outgoing events across multiple consumers. In order for every consumer of a topic to receive events from the topic, the number of partitions has to match or exceed the number of consumers. This means that if our system faces a spike in load and scales the number of pipeline instances up past the number of partitions, any excess instances essentially sit dormant.
One way to address this would be to cap autoscaling so that the number of pipeline instances never grows higher than the number of partitions in its source topic. However, this would come at the cost of not being able to keep up with the additional load, potentially turning our processor into a performance bottleneck for the system.
Another way to address this would be for users of Inflect to manually ensure that the number of partitions in a topic exceeds the number of replicas consuming from that topic. However, there may be times when an unanticipated spike in load arrives, and we want our system to respond faster than a developer could manually scale the system.
Our solution was to implement a partition autoscaler that is called by the app whenever the number of instances for a pipeline exceeds the number of partitions in that pipeline’s source topic. This ensures that the partitions needed to scale the number of consumers become available when needed, allowing the system to scale efficiently and maintain high throughput without requiring real-time manual intervention.
However, one major issue with this approach is that increasing the number of partitions in a Kafka topic is irreversible. Having more Kafka topics than consumers results in excess resource usage by the broker, as well as greater latency when routing messages to consumers – for optimal performance, the number of topic partitions should match the number of consumers. Because of this, we configured this partition autoscaling functionality to be optional for teams that prefer to adopt a different approach to managing Kafka partitions. 4.5 Assessing performance With Inflect deployed as many deployments, each with its own set of pods that scale up and down with load, we wanted to be able to assess the throughput and performance of the system as a whole. And, users in a production EDA will generally want visibility into the performance of their various components, including Inflect. The solution here was to instrument our code. 4.5.1 Prometheus Prometheus is an open-source systems monitoring and alerting toolkit used to collect and store time-stamped data as metrics. Users can then query the metrics in order to get a glimpse into system performance, resource utilization, and the health of the application. And importantly, Prometheus offers native Kubernetes integration, making it a natural choice for measuring the performance of Inflect.
Using Prometheus, each pod hosts an HTTP metrics server that exposes relevant data, including the number of events processed, the number of times events got routed to a DLQ or dropped, and the message processing duration in seconds. Prometheus periodically scrapes these metrics endpoints and makes the collected data available both through its browser-based user interface and through APIs that other system components can interact with. Users can then query and aggregate these metrics to evaluate the performance of the entire system, individual pipelines, or specific pods.

For teams already using Grafana, a popular analytics and data visualization platform in other parts of their system, integrating these Prometheus metrics is straightforward. Users can incorporate the Inflect performance data into their existing Grafana dashboards by adding Prometheus as a data source, after which they can create dashboards and panels to visualize the data produced by Inflect, giving users of Inflect observability into the performance of the stream processors.
Final Architecture
Full Architecture

Kubernetes Deployment

Inflect’s Kubernetes cluster includes several components that work in tandem: One deployment for each pipeline, with each pipeline being composed of one or more pods, which are instances of the Inflect stream processing application A PostgreSQL database deployment, from which the data used to deploy each pipeline is pulled A Prometheus deployment, which scrapes the /metrics endpoints of each instance of Inflect A KEDA deployment, which works with Kubernetes to manage scaling the number of pods in a deployment up and down in response to consumer lag